Try the free Compa Ratio Calculator now — Instantly calculate compa ratios for your employees and streamline your compensation analysis.
Click to try the interactive calculator
Introduction
A compa ratio calculator is an essential tool for HR, compensation, and finance professionals seeking to ensure fair, market-aligned pay within their organizations. This article is designed specifically for those responsible for managing employee compensation, salary structures, and pay equity. Here, you'll learn how to use compa ratio calculators, why they matter in today’s competitive labor market, and practical applications for integrating compa ratio analysis into your compensation strategy.
The importance of compa ratio analysis cannot be overstated: it provides a clear, standardized metric for comparing employee pay to salary range midpoints or market data, helping organizations make informed, defensible decisions about pay positioning. By leveraging a compa ratio calculator—a tool that quickly computes the relationship between an employee’s actual salary and the midpoint of their salary range—HR teams can identify underpayment, overpayment, and pay compression, all while supporting compliance and pay equity initiatives.
Whether you are planning merit cycles, conducting pay equity audits, or benchmarking against the market, understanding and applying compa ratio analysis is crucial for maintaining competitive, transparent, and equitable compensation practices.
Key Takeaways
-
Compa ratio compares an employee’s actual base salary to the salary range midpoint, helping HR teams quickly assess pay positioning across individuals and groups.
-
The standard compa ratio formula is (Actual Salary ÷ Salary Range Midpoint) × 100, with most organizations targeting 80-120% depending on performance and market conditions.
-
HR professionals can use compa ratio calculators to identify underpayment, overpayment, and pay compression when planning merit cycles and market adjustments.
-
While powerful for pay analysis, compa ratios work best when combined with real-time market data, range penetration metrics, and comprehensive pay equity analysis.
-
Modern compensation teams integrate compa ratio analysis into recurring workflows rather than using it as a one-time calculation.
Compa ratio is a fast way for HR and compensation teams to compare actual pay to salary range midpoints or market data, giving organizations a clear metric for pay positioning decisions. SalaryCube offers a free online compa ratio calculator specifically designed for U.S. organizations looking to streamline their compensation analysis. The core formula—compa ratio = (Actual Salary ÷ Salary Range Midpoint) × 100—helps most organizations target between 80% and 120% depending on employee level, performance, and current market conditions.
HR and compensation teams can use a compa ratio calculator to quickly flag underpayment, overpayment, and pay compression when planning 2025 merit cycles, promotions, and market adjustments. However, compa ratios are powerful but incomplete on their own and should be used alongside real-time market data, range penetration analysis, and pay equity reviews to drive defensible compensation decisions.
Try the compa ratio calculator to start analyzing your organization’s pay positioning, or book a demo to see how compa ratios integrate with live salary benchmarking in SalaryCube.
What is a compa ratio? (For HR and compensation teams)
Compa ratio, short for comparative ratio or compensation ratio, measures the relationship between an employee’s actual base salary and the midpoint of the relevant salary range or market benchmark, expressed as a percentage. In other words, compa ratio directly compares an employee’s pay to the salary range midpoint, which is typically set to reflect current market data for that role and level. This relationship allows HR and total rewards teams to assess whether pay is below, at, or above the intended market position.
A compa ratio calculator is a tool that automates this calculation, allowing HR professionals to quickly determine the compa ratio for individuals or groups by inputting actual salary and the relevant salary range midpoint or market reference.
HR teams typically use compa ratios at three levels: individual employees (for performance reviews and promotion decisions), groups like departments or job families (for budget planning and systemic analysis), and organization-wide (for executive reporting and board presentations). The calculation provides a quick diagnostic that answers the fundamental question: “Where does this person’s pay sit relative to our salary structure and the market?”
A compa ratio of 100% means an employee’s pay equals the midpoint of their salary range—essentially “at market” if the midpoint represents current market rates. Ratios below 100% indicate the employee’s pay is below the midpoint, while ratios above 100% show pay above the midpoint. For example, a compa ratio of 95% means the employee earns 95% of the range midpoint, while 110% indicates they earn 10% above the midpoint.
This article focuses specifically on U.S.-based compensation practices, as salary structures, market data, and regulatory requirements vary significantly by country. SalaryCube’s data and tools are built exclusively on U.S. labor market information to ensure accuracy and compliance with American compensation standards. The audience for this content is HR, total rewards, and finance leaders—not individual job seekers—since compa ratio serves as a management metric for organizational pay decisions rather than a personal salary negotiation tool.
Now that we've defined compa ratio and its relationship to salary range midpoints and market data, let's explore why it matters in modern compensation strategy.
Why compa ratio matters in modern compensation strategy
Current HR challenges in 2024–2025 include heightened pay transparency expectations and state pay range disclosure laws in California, New York, Colorado, Washington, and other jurisdictions requiring salary range posting. Additionally, rapid market shifts since 2020—driven by COVID-19 impacts, remote work normalization, tech sector volatility, and persistent inflation—have made traditional annual surveys feel outdated by the time they’re published.
Compa ratio gives HR a fast, standardized metric to check: “Are we paying this role in line with our salary ranges and current market?” without launching a full compensation study every time they need to evaluate pay positioning. This speed becomes critical when organizations need to make competitive offers quickly or respond to retention challenges in hot talent markets.
Specific applications include managing salary budgets ahead of annual merit cycles by identifying which employees or groups need the largest adjustments to reach target positioning. HR teams also use compa ratios to spot pay compression between new hires and tenured staff—for instance, when new market entrants come in at 95% of midpoint while loyal incumbents sit at 88%. The metric helps test proposed salary ranges before rollout by calculating how current employees would be positioned in new structures. Finally, compa ratios support pay equity audits by providing a consistent framework to compare compensation across demographics within similar job levels.
Compa ratios support transparent pay philosophies by giving HR a concrete, defensible number they can use in conversations with leadership, auditors, and—where organizations embrace full transparency—employees themselves. When paired with clearly written compensation philosophies (such as “We aim to pay most employees between 95% and 105% of market midpoint”), compa ratios become an operational mechanism to manage toward stated targets.
SalaryCube’s modern compensation intelligence platform pairs compa ratio analysis with real-time salary benchmarking to help organizations avoid relying on stale survey cycles that may no longer reflect current market conditions, especially in fast-moving roles like software engineering or healthcare specializations.
With an understanding of why compa ratio is so valuable, let’s move on to how to calculate compa ratio step-by-step.
How to calculate compa ratio (step-by-step)
This section walks through the standard compa ratio formula, demonstrates how to apply it manually, and shows how to use an online calculator to streamline the process. Understanding both manual calculation and automated tools helps HR teams choose the right approach for different scenarios—from quick individual checks to organization-wide analysis.
The Standard Compa Ratio Formula
The core formula is straightforward: Compa ratio = (Actual Base Salary ÷ Salary Range Midpoint) × 100. HR teams can express results as either a decimal (0.90) or a percentage (90%), with percentages being more common in executive reporting and employee communications. The key is consistency across all calculations within an organization.
Here’s a concrete example: A Senior Marketing Manager earns $72,000 annually, and the salary range midpoint for that role is $80,000. The calculation becomes: 72,000 ÷ 80,000 = 0.90, or 90% when expressed as a percentage. This indicates the employee earns 10% below the range midpoint.
The midpoint used in calculations can come from several sources: internal salary ranges (where midpoint sits between the range minimum and maximum), a blended midpoint built from multiple salary surveys, or a live market benchmark from a platform like SalaryCube’s Salary Benchmarking product. The source affects accuracy significantly, so HR teams should document which midpoint they’re using and ensure it reflects current market conditions.
Before calculating any compa ratio, HR should confirm several data points: ensure the employee’s salary figure represents current annualized base pay excluding bonuses and equity, verify the employee is mapped to the correct job code and level in your HRIS, and confirm FLSA status (Fair Labor Standards Act status; learn more here) since hourly employees need their pay annualized consistently (typically using 2,080 hours for full-time equivalent).
Using the free compa ratio calculator
HR professionals can avoid manual calculations entirely by using SalaryCube’s free online compa ratio calculator, which works directly in any web browser without requiring spreadsheet downloads or software installation. This approach reduces calculation errors and speeds up the process when analyzing individual employees or small groups.
The typical calculator requires just a few inputs: the employee’s annual base salary, the midpoint or market reference salary for their role, and optional fields like employee ID or job title that help HR track results internally. Some calculators also allow bulk entry for multiple employees at once, though individual entry works well for targeted analysis during performance reviews or promotion discussions.
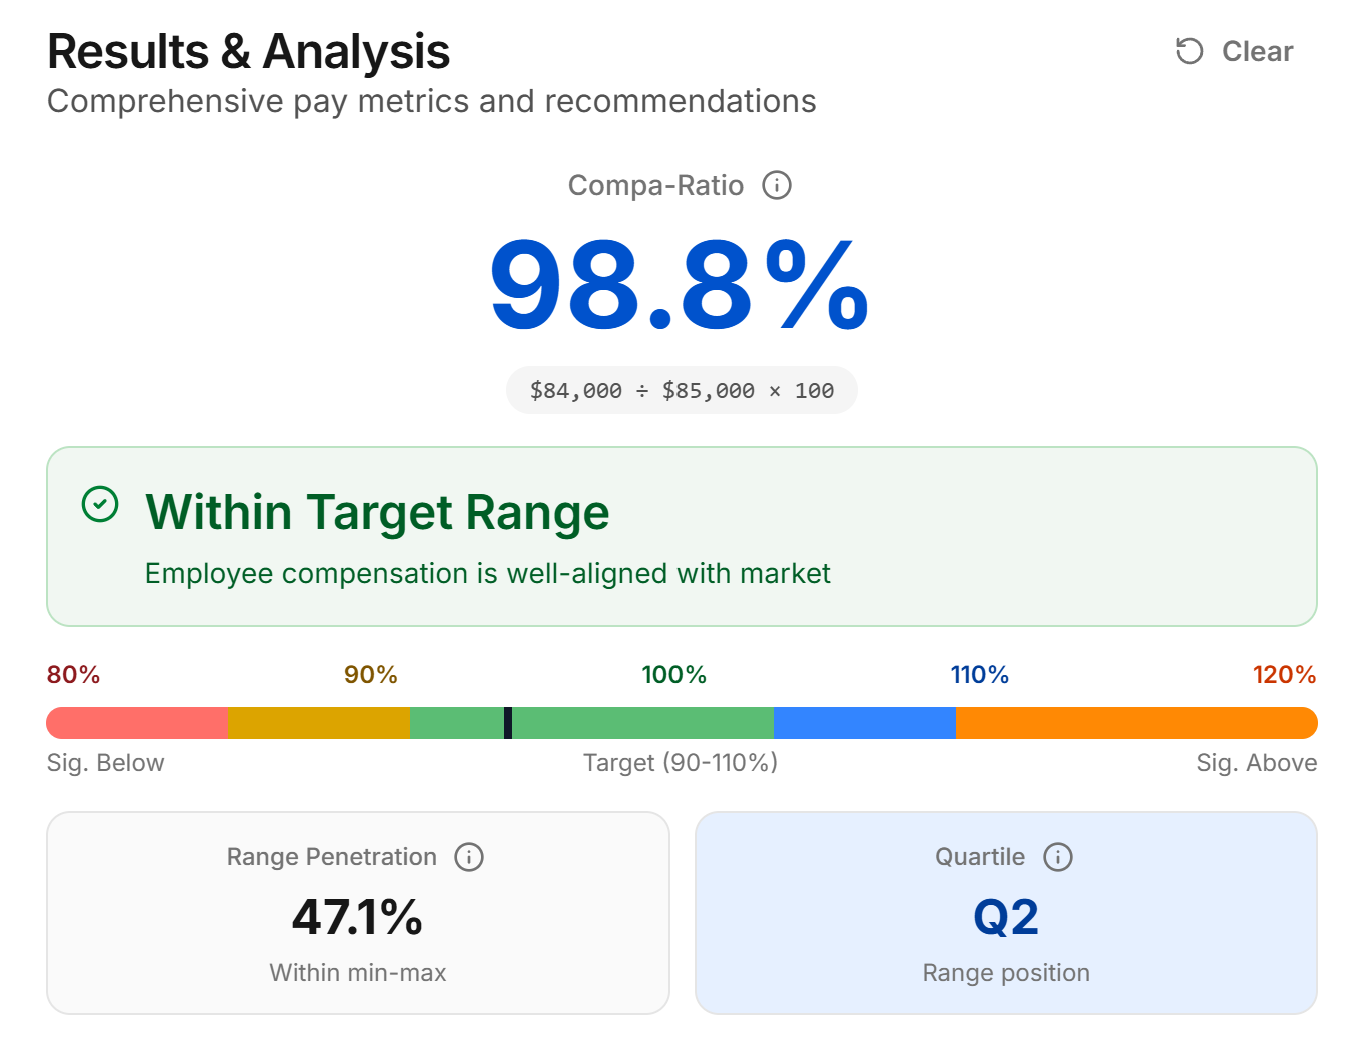
Calculator outputs include the compa ratio expressed as both a percentage and decimal, a status label or color indicator (such as “below range,” “at target,” or “above range”) that provides immediate visual guidance, and interpretation text suggesting next steps for HR consideration. Advanced calculators might also show how far the employee sits from common target bands like 90-110%.
The same page typically links to other free compensation tools that complement compa ratio analysis, such as salary-to-hourly converters (useful for converting hourly employee pay to annual figures) and wage raise calculators that help model the dollar impact of bringing employees to target compa ratios.
Manual calculation checklist for HR teams
When calculating compa ratios in Excel or through HRIS reports, HR teams should follow a systematic checklist to ensure accuracy and consistency. First, verify that all salary figures represent annualized base pay for the same time period—avoid mixing pre-merit and post-merit figures or including partial-year adjustments without proper normalization.
Confirm which pay period the salaries reference, particularly when calculating during or immediately after merit cycles. For example, clearly distinguish between “2024 ending base salary” and “2025 starting base salary” to avoid comparing outdated figures to current market midpoints. Align each employee to a single, authoritative range midpoint and avoid using multiple inconsistent sources unless differences are clearly documented and justified.
A simple Excel formula for bulk calculations is: = (Actual_Salary_Cell / Midpoint_Cell) * 100. Format the result cell as a percentage with one decimal place for consistency with HR reporting standards. When building spreadsheets, include columns for employee ID, job title, department, and calculation date to support audit trails and future updates.
Organizations using SalaryCube can export benchmarked ranges and midpoints directly into CSV or Excel format with unlimited reporting capabilities, eliminating the need to manually re-key data from survey books or PDFs. This integration streamlines the process and reduces transcription errors that commonly occur in manual data entry.
Document your chosen midpoint source and calculation date for compliance and audit purposes. Include details such as “2025 market medians from SalaryCube Salary Benchmarking as of January 2025” to create defensible records that support pay equity analysis and regulatory reviews.
Now that you know how to calculate compa ratios, let’s look at the different types of compa ratios and how they are used in practice.
Types of compa ratios: individual, group, and average
The underlying compa ratio formula remains identical across different applications, but HR teams apply it to individuals, specific groups, or entire populations to answer distinct strategic questions. Individual calculations help with performance management and career progression decisions, group calculations reveal systemic patterns across departments or demographics, and average calculations provide executive-level summaries for board reporting and budget planning.
This section breaks down each type with realistic corporate scenarios, such as benchmarking a software engineering team in Austin during 2025’s competitive market or reviewing a finance department before mid-year market adjustments. Examples use simplified but precise math to illustrate how each calculation type serves different HR needs.
Individual compa ratio
Individual compa ratio applies the standard calculation to a single employee: Actual Salary ÷ Salary Range Midpoint × 100. This metric becomes essential during performance reviews, promotion discussions, retention conversations, and new hire offer calibration, giving managers and HR specific data to support pay decisions.
Consider this example: A Senior HR Generalist in Chicago earns $95,000 annually, while the salary range midpoint for Senior HR Generalist roles in that market is $100,000. The calculation yields: 95,000 ÷ 100,000 = 0.95, or 95%. This employee earns 5% below the range midpoint, suggesting room for growth toward target positioning depending on performance and tenure.
HR teams use individual compa ratios in multiple contexts: during annual reviews to assess whether strong performers have space for meaningful increases, in promotion cases to determine appropriate salary adjustments when employees move to higher-level roles, for off-cycle market adjustments when external offers threaten valued employees, and when setting offers for new hires to ensure consistency with internal pay equity.
Individual compa ratios require careful interpretation alongside other factors. A high performer at 95% might be prioritized for a larger merit increase over a mid-performer at 102%, depending on the organization’s compensation philosophy and available budget. Similarly, a new hire at 88% might be appropriately positioned for their experience level, while a tenured specialist at the same ratio could indicate potential underpayment requiring correction.
Group compa ratio
Group compa ratio aggregates data across defined populations using the formula: (Sum of Actual Salaries in a group ÷ Sum of Range Midpoints for that group) × 100. This calculation helps HR identify systemic patterns across teams, departments, job families, locations, or demographic segments that individual analysis might miss.
Here’s a practical example: A five-person marketing team has combined salaries of $420,000, while the sum of their individual range midpoints totals $450,000. The group compa ratio becomes: 420,000 ÷ 450,000 = 0.933, or 93.3%. This indicates the entire marketing team averages about 7% below midpoint, suggesting potential systematic underpayment or outdated salary ranges.
Group compa ratios reveal important organizational patterns: certain regions or offices where average pay consistently falls below midpoint (indicating possible market lag or cost-of-living misalignment), legacy business units where tenured staff cluster above 110-115% (signaling potential pay compression or range drift), and differences across demographic groups when comparing equivalent roles and levels (supporting pay equity analysis and compliance).
SalaryCube’s Bigfoot Live module enhances group analysis by overlaying real-time market data to determine whether low group compa ratios reflect genuine organizational underpayment or internal midpoints that no longer represent current market reality. This distinction becomes critical when deciding whether to adjust individual salaries or refresh entire salary structures.
Average compa ratio
Average compa ratio calculates the mean of individual compa ratios across a defined population: (Sum of individual compa ratios ÷ Number of employees). This differs mathematically from group compa ratio because it treats each employee equally regardless of salary level, making it useful for high-level summaries and executive reporting.
For example, if 10 employees have individual compa ratios ranging from 82% to 118%, the average compa ratio might be 97%. This single figure summarizes overall pay alignment for executive dashboards, board reports, or compensation committee presentations, providing a quick sense of whether the population generally sits above or below target positioning.
Average compa ratios work well for summarizing large populations and tracking trends over time—such as monitoring whether the average compa ratio for a job family increases following market adjustments or decreases due to new hire volume at entry-level positioning. They also facilitate benchmarking against industry standards when external surveys provide average compa ratio data.
However, averages can hide critical outliers and distribution issues. A population with an average compa ratio of 97% might include some employees at 75% (indicating significant underpayment risk) and others at 125% (suggesting possible overpayment or misclassification). Best practice pairs average compa ratios with distribution analysis—histograms, quartiles, and demographic segmentation—particularly when supporting pay equity audits and compliance reviews.
With a clear understanding of the types of compa ratios, let’s examine what constitutes a good compa ratio range for your organization.
What is a good compa ratio range?
No universal “correct” compa ratio exists across all employers, but most U.S. organizations target ranges between 80% and 120% of midpoint, with many setting tighter internal guidelines around 90-110% for their core employee populations. The definition of “good” depends heavily on organizational compensation philosophy, industry norms, geographic markets, and current talent supply and demand.
A frequently cited rule-of-thumb framework breaks down as follows: 80-90% for newer, less experienced, or developing employees who are typically early in their range progression or recently hired; 90-100% for fully competent employees who consistently meet role expectations and perform their duties as defined; 100-110% for strong performers who exceed expectations or possess valuable specialized skills; and 110-120% for exceptional performers, critical skill holders, or employees in hard-to-fill roles where market premiums apply.
Industry context significantly affects these ranges. Technology firms in competitive markets like San Francisco or Austin might intentionally target 100-115% compa ratios to “lead” the market for critical software engineering talent. Healthcare systems competing for specialized clinical roles often accept similar premiums. Conversely, public sector employers or non-profit organizations might target 85-100% relative to private sector benchmarks, balancing their mission-driven appeal with budget constraints.
Compa ratios below approximately 80% often indicate significant underpayment relative to structure and market, potentially creating retention risk, pay equity concerns, or compliance issues. Such low ratios might also suggest mis-leveled roles where employees are classified in ranges too high for their actual responsibilities, or outdated salary ranges that haven’t kept pace with market evolution.
Ratios above approximately 120% may reflect legitimate business needs—such as retention premiums in hot markets or recognition of truly exceptional contributors—but can also signal structural problems. These include pay compression where new hires enter below midpoint while incumbents accumulate above-range positioning, misclassification of roles into inappropriate salary grades, or range structures that need refreshing to match current market realities.
Modern platforms like SalaryCube help HR teams test whether their target compa ratio bands reflect realistic expectations given live market data in specific U.S. metros and job families, rather than relying on static assumptions that may not match current labor market conditions.
What does a compa ratio of 75 mean?
A compa ratio of 0.75 (or 75%) means an employee’s base salary is 25% below the midpoint of their pay range. This typically signals significant underpayment that warrants investigation. Common causes include: market rates rising faster than internal adjustments, employees hired at below-market rates during budget constraints, role responsibilities expanding without corresponding pay changes, or outdated salary ranges that no longer reflect current market conditions.
Organizations should treat compa ratios below 80% as a priority for review. Remediation options include targeted salary adjustments during the next merit cycle, off-cycle market corrections for retention-critical roles, reclassifying the role into a more appropriate pay grade if responsibilities have changed, or updating the salary range midpoint using current market data from platforms like SalaryCube to verify whether the range itself needs refreshing before adjusting individual pay.
Now that you know what a good compa ratio range looks like, let’s compare compa ratio to another important metric: range penetration.
Compa ratio vs. range penetration
Compa ratio and range penetration are related but distinct metrics that modern compensation teams typically track together to gain complete insight into employee pay positioning. While both involve salary ranges, they answer fundamentally different questions about where employees sit relative to their pay structure.
Range penetration is a metric that measures how far an employee’s salary has progressed within their assigned salary range, from the minimum to the maximum. It answers: “Where does this employee’s salary fall within the range itself from minimum to maximum?”
Compa ratio answers: “How does this employee’s pay compare to the midpoint or market reference for their range?” Range penetration answers: “Where does this employee’s salary fall within the range itself from minimum to maximum?”
Range penetration uses this formula: (Actual Salary – Range Minimum) ÷ (Range Maximum – Range Minimum) × 100. This produces a percentage from 0% (at range minimum) to 100% (at range maximum), with 50% representing the mathematical center of a symmetrical range.
Consider this side-by-side example: An employee has a salary range of $60,000 (minimum) to $90,000 (maximum), with a midpoint of $75,000. Their current salary is $75,000. The compa ratio calculates as: 75,000 ÷ 75,000 = 1.0, or 100% (exactly at midpoint). The range penetration calculates as: (75,000 – 60,000) ÷ (90,000 – 60,000) = 15,000 ÷ 30,000 = 0.5, or 50% (halfway through the range).
Compa ratio excels at assessing market alignment against a central reference point, making it ideal for budget planning, market competitiveness analysis, and pay equity reviews. Range penetration excels at managing progression within ranges, supporting decisions about tenure-based advancement, internal equity among team members, and career development pathways.
An employee might have a compa ratio near 100% (indicating good market alignment) but high range penetration if the range structure is asymmetrical or the midpoint doesn’t sit at the mathematical center. Understanding both metrics helps HR make more nuanced decisions about individual career progression and overall range architecture effectiveness.
With both compa ratio and range penetration in your toolkit, it’s important to understand the limitations of compa ratio and how to address them.
Limitations of compa ratio (and how to address them)
While compa ratio serves as a fundamental compensation metric, it carries important limitations that require HR teams to use it alongside other data rather than as a standalone decision-making tool. Understanding these constraints helps organizations build more comprehensive and defensible compensation strategies.
Base salary focus only
- Compa ratio captures only base salary and ignores total rewards including bonuses, equity grants, benefits packages, and non-monetary perks. An employee with a 85% compa ratio but substantial annual incentives might be competitively positioned overall, while someone at 105% base with minimal additional compensation could lag total market value.
Midpoint accuracy dependency
- The entire calculation hinges on accurate, current midpoints that truly represent market conditions. Compa ratios based on 2022 survey data in late 2024-2025 economic conditions can mislead significantly, especially in volatile sectors like technology, healthcare, or skilled trades where market rates shift rapidly.
Job leveling sensitivity
- Incorrect job classifications produce meaningless compa ratios. Employees mis-leveled into ranges too high for their actual scope will appear underpaid, while those in ranges too low will seem overpaid. Without standardized job descriptions and clear level criteria, compa ratio comparisons across populations become invalid.
Outlier masking in averages
- Group and average compa ratios can hide critical individual disparities. A department with a healthy 98% average compa ratio might include some employees at 75% (significant underpayment) and others at 115% (potential overpayment), masking problems that need individual attention.
Lack of explanatory context
- Compa ratios identify gaps but don’t explain causes. A low ratio could be appropriate (new hire still ramping, performance improvement needed) or problematic (systematic bias, outdated ranges). The metric requires additional context to drive appropriate action.
Common operational pitfalls include relying on manual Excel files that drift from HRIS data, especially after promotions and job changes; inconsistent midpoint update cycles where some roles refresh annually while others lag multiple years; and dependence on single survey sources that may over- or under-represent market reality for specific positions.
Organizations can address these limitations by pairing compa ratios with complementary metrics (performance ratings, tenure, range penetration, demographic analysis), using real-time or frequently updated market data rather than annual survey cycles, implementing standardized job architectures supported by clear descriptions and level definitions, and maintaining rigorous documentation of data sources, methodology decisions, and calculation dates.
SalaryCube’s platform addresses several core limitations by providing real-time U.S. salary data, transparent methodology with audit trails, and automated exports that keep midpoints current and traceable, helping HR teams build more reliable compa ratio analysis.
Now that you’re aware of the limitations and how to address them, let’s discuss how to use compa ratios strategically in your compensation processes.
How to use compa ratios in your compensation strategy
Compa ratios become most powerful when embedded into recurring compensation workflows rather than used as occasional spreadsheet exercises. Strategic integration helps organizations maintain consistent pay practices, support compliance requirements, and make data-driven decisions throughout the year rather than only during annual merit cycles.
This approach requires establishing regular review cadences, connecting compa ratio insights to pay equity initiatives, linking analysis to budget planning processes, and enabling managers to understand and use compa ratio data effectively in their team leadership responsibilities.
Build a recurring compa ratio review cadence
Leading compensation teams establish at least annual organization-wide compa ratio reviews before primary merit cycles, typically in Q4 or Q1, with many adding quarterly or semiannual focused reviews for critical roles or volatile markets. This systematic approach prevents compensation drift and ensures proactive rather than reactive pay management.
A standard workflow begins with exporting current employee data from your HRIS, including base salary, job title, level, location, department, and relevant demographic information for segmentation analysis. Next, align each employee to a current, validated midpoint from your chosen market data source—whether internal ranges, updated survey results, or real-time benchmarks. Calculate individual compa ratios, then segment results by key dimensions: department, function, job level, location, and demographic groups for pay equity analysis.
The analysis phase identifies patterns requiring attention: employees or groups with very low ratios (potential underpayment), very high ratios (possible overpayment or misclassification), and demographic disparities within similar roles and levels. Document target compa ratio bands by job level or family—such as 90-105% for professional roles or 95-110% for senior specialists—and use these as guidelines during compensation review discussions.
SalaryCube’s Salary Benchmarking product streamlines this process by providing updated midpoints quickly, allowing HR teams to complete comprehensive reviews in hours rather than weeks of manual survey extraction and data manipulation.
Use compa ratio in pay equity and compliance work
Compa ratios provide a standardized framework for pay equity analysis, particularly when comparing employees in similar jobs and levels across different demographic groups. This application has become increasingly critical as organizations face enhanced regulatory scrutiny and internal commitment to equitable pay practices.
The typical analytical approach involves calculating individual compa ratios for all employees within defined job families and levels, then segmenting results by gender, race/ethnicity, and other legally appropriate categories. Look for patterns where one demographic group’s average compa ratio consistently differs from others within the same role level—for example, women averaging 92% while men average 100% in equivalent engineering positions.
Investigation of identified gaps should consider legitimate explanatory factors including recent hire timing (market rate changes), performance differences (documented through formal review processes), tenure and experience variations, and geographic location differences. However, unexplained gaps that persist after accounting for these factors may indicate systematic bias requiring remediation.
Strong pay equity practice documents both the analysis methodology and remediation plans, creating audit trails that support compliance with equal pay regulations in jurisdictions with robust enforcement. Using current, defensible market data from platforms like SalaryCube helps ensure equity adjustments align with demonstrable market realities rather than subjective judgment calls.
Link compa ratios to budget and headcount planning
Average and group compa ratios by function or location provide valuable inputs for salary budget requests and workforce planning, helping finance and HR leaders model costs and set realistic expectations for compensation investments. This forward-looking application supports strategic decision-making beyond individual employee adjustments.
If the average compa ratio for software engineering sits at 88% during 2025 planning cycles, HR can model budget scenarios including the cost to bring all engineers to at least 95%, the investment required to eliminate demographic disparities within the function, and the financial impact of re-leveling positions where job scope has expanded significantly.
Scenario modeling capabilities become particularly valuable when organizations consider structural changes: adjusting salary ranges upward by 5-10% in competitive markets and recalculating resulting compa ratios, shifting employees to new job levels or families and projecting positioning in updated ranges, and estimating the ongoing cost of maintaining target compa ratios as new hires enter at current market rates.
Unlimited reporting and export features allow compensation teams to refresh these models repeatedly without vendor fees or consulting delays, supporting iterative planning processes that adapt to changing business needs and market conditions throughout the budget cycle.
The strategic connection between compa ratios and compensation philosophy requires alignment: if your organization commits to paying at the 60th percentile of market (leading position), target compa ratios should reflect 100-110% positioning, with budgets supporting the premium required to maintain that stance consistently.
Train managers to understand and use compa ratios correctly
Line managers increasingly encounter compa ratio concepts as pay transparency expands and HR involves them more directly in compensation discussions. Proper manager education prevents miscommunication with employees and ensures consistent messaging across the organization about pay positioning and progression.
Effective training provides managers with a concise, practical explanation covering what compa ratio measures, why not every employee sits at 100%, and how performance, skills, and tenure influence appropriate positioning within target ranges. Standardized talking points help managers explain that compa ratio is one factor among many in pay decisions, avoiding promises to move everyone to 100% immediately that might conflict with budget realities or overall compensation strategy.
Real-world scenarios help managers practice applying compa ratio concepts: discussing why a strong performer at 87% might receive a larger merit increase than a solid performer at 103%, explaining to an employee why their 95% positioning represents fair market alignment rather than underpayment, and addressing questions about range positioning during performance reviews or career development conversations.
Anonymous dashboards or sample data from compensation platforms can support training sessions, allowing managers to see realistic examples and practice interpretation without exposing confidential employee information. This hands-on approach builds confidence and competency that translates to more effective compensation conversations throughout the year.
With these strategies, your organization can fully leverage compa ratio analysis for ongoing compensation management and pay equity.
How SalaryCube supports compa ratio analysis
SalaryCube serves as a modern compensation intelligence platform built specifically for U.S.-based HR and compensation teams who need fast, defensible compa ratio insights without the complexity and delays associated with traditional survey-based approaches. For a detailed comparison of platforms that support compa ratio analysis, see our guide to salary benchmarking tools. The platform addresses common frustrations with outdated data, manual processes, and limited analytical capabilities that constrain effective compensation management.
DataDive Pro provides real-time midpoints and salary ranges for both traditional and hybrid roles, ensuring compa ratio calculations reflect today’s market reality rather than last year’s survey data. This capability becomes particularly valuable for analyzing blended positions like “Product Manager + Data Analyst” or “Nurse + Case Manager” that don’t fit cleanly into standard survey categories but represent growing portions of modern workforces.
Bigfoot Live updates salary data daily, allowing HR teams to refresh compa ratio baselines quickly when analyzing fast-moving roles in software engineering, data science, clinical specializations, and other high-velocity markets. This real-time capability helps organizations respond to market shifts proactively rather than discovering misalignment months after competitive positioning has deteriorated.
Standardizing job content and level definitions before compa ratio calculation ensures analysis is based on properly defined roles rather than inconsistent or outdated position descriptions. This foundation prevents the common problem of calculating accurate compa ratios on incorrectly classified jobs, which leads to misleading results and poor compensation decisions.
The platform’s unlimited reporting capability allows compensation teams to export data in CSV, PDF, and Excel formats without per-report fees, supporting iterative analysis, budget modeling, and cross-departmental collaboration without constraining exploration due to cost concerns.
Book a demo or watch interactive demos to see how your team could replace manual spreadsheets and static survey reports with real-time, self-service compensation analytics that scale with your organization’s growth and complexity.
FAQ: Compa ratio calculator and practical questions
Can we use a compa ratio calculator if we don’t have formal salary ranges yet?
Organizations without established salary ranges can still leverage compa ratio analysis by using live market benchmarks as provisional midpoints. Platforms like SalaryCube provide current market data that can serve as reference points while you develop formal range structures. Start by benchmarking your most critical roles and use those market midpoints for initial compa ratio calculations, then expand coverage as your compensation framework matures.
How often should we update the midpoints used in our compa ratio calculator?
Best practice calls for updating salary range midpoints at least annually, often aligned with your fiscal year or merit cycle timing. However, organizations in fast-moving markets or with critical skill roles should consider more frequent updates every 6-12 months. Hot talent markets like technology hubs may require quarterly refresh cycles for technical positions to maintain competitive accuracy in compa ratio analysis.
Does compa ratio include bonuses, equity, or other incentives?
Standard compa ratio calculations use base salary only, excluding variable compensation like bonuses, commissions, and equity grants. This separation allows HR teams to analyze base pay positioning independently from total compensation elements that may fluctuate based on performance or company results. Organizations that want to include total compensation should calculate separate “total comp compa ratios” while maintaining base-only calculations for salary administration and compliance work.
How many employees can we analyze with a compa ratio calculator?
Most online calculators work best for individual roles or small groups when conducting initial analysis or spot checks. For populations in the hundreds or thousands, HR teams typically export data from their HRIS and calculate ratios in bulk using Excel formulas or specialized compensation platforms like SalaryCube that can process and visualize thousands of employees’ compa ratios across multiple dimensions simultaneously.
What’s the next step after we calculate compa ratios for our organization?
Start by segmenting results to identify high-priority patterns: very low ratios indicating potential underpayment, demographic gaps that might suggest pay equity issues, and specific departments or job families with systematic positioning problems. Prioritize interventions based on legal compliance risk, retention concerns, and budget availability. Consider implementing a platform like SalaryCube to connect compa ratio analysis with ongoing, real-time market benchmarking rather than treating it as a periodic manual exercise.
Next steps
Compa ratios, when powered by current U.S. market data and embedded in standardized processes, help HR teams build fair, transparent, and defensible pay strategies that support both compliance requirements and competitive talent acquisition. The metric serves as a critical bridge between high-level compensation philosophy and day-to-day pay decisions, giving organizations a consistent framework for maintaining equity and market competitiveness.
Start by trying the compa ratio calculator to understand your current state and identify immediate opportunities for improvement. Then explore how SalaryCube can automate and scale this analysis across all your roles, connecting compa ratio insights with real-time market benchmarking to eliminate dependence on outdated survey cycles and manual processes.
If you want real-time, defensible salary data that HR and compensation teams can actually use to drive strategic decisions and maintain competitive positioning, book a demo with SalaryCube.